I am trying to plot some data from a camera in real time using OpenCV. However, the real-time plotting (using matplotlib) doesn't seem to be working.
I've isolated the problem into this simple example:
fig = plt.figure() plt.axis([0, 1000, 0, 1]) i = 0 x = list() y = list() while i < 1000: temp_y = np.random.random() x.append(i) y.append(temp_y) plt.scatter(i, temp_y) i += 1 plt.show() I would expect this example to plot 1000 points individually. What actually happens is that the window pops up with the first point showing (ok with that), then waits for the loop to finish before it populates the rest of the graph.
Any thoughts why I am not seeing points populated one at a time?
014 Answers
Here's the working version of the code in question (requires at least version Matplotlib 1.1.0 from 2011-11-14):
import numpy as np import matplotlib.pyplot as plt plt.axis([0, 10, 0, 1]) for i in range(10): y = np.random.random() plt.scatter(i, y) plt.pause(0.05) plt.show() Note the call to plt.pause(0.05), which both draws the new data and runs the GUI's event loop (allowing for mouse interaction).
If you're interested in realtime plotting, I'd recommend looking into matplotlib's animation API. In particular, using blit to avoid redrawing the background on every frame can give you substantial speed gains (~10x):
#!/usr/bin/env python import numpy as np import time import matplotlib matplotlib.use('GTKAgg') from matplotlib import pyplot as plt def randomwalk(dims=(256, 256), n=20, sigma=5, alpha=0.95, seed=1): """ A simple random walk with memory """ r, c = dims gen = np.random.RandomState(seed) pos = gen.rand(2, n) * ((r,), (c,)) old_delta = gen.randn(2, n) * sigma while True: delta = (1. - alpha) * gen.randn(2, n) * sigma + alpha * old_delta pos += delta for ii in xrange(n): if not (0. <= pos[0, ii] < r): pos[0, ii] = abs(pos[0, ii] % r) if not (0. <= pos[1, ii] < c): pos[1, ii] = abs(pos[1, ii] % c) old_delta = delta yield pos def run(niter=1000, doblit=True): """ Display the simulation using matplotlib, optionally using blit for speed """ fig, ax = plt.subplots(1, 1) ax.set_aspect('equal') ax.set_xlim(0, 255) ax.set_ylim(0, 255) ax.hold(True) rw = randomwalk() x, y = rw.next() plt.show(False) plt.draw() if doblit: # cache the background background = fig.canvas.copy_from_bbox(ax.bbox) points = ax.plot(x, y, 'o')[0] tic = time.time() for ii in xrange(niter): # update the xy data x, y = rw.next() points.set_data(x, y) if doblit: # restore background fig.canvas.restore_region(background) # redraw just the points ax.draw_artist(points) # fill in the axes rectangle fig.canvas.blit(ax.bbox) else: # redraw everything fig.canvas.draw() plt.close(fig) print "Blit = %s, average FPS: %.2f" % ( str(doblit), niter / (time.time() - tic)) if __name__ == '__main__': run(doblit=False) run(doblit=True) Output:
Blit = False, average FPS: 54.37 Blit = True, average FPS: 438.27 I know I'm a bit late to answer this question. Nevertheless, I've made some code a while ago to plot live graphs, that I would like to share:
Code for PyQt4:
################################################################### # # # PLOT A LIVE GRAPH (PyQt4) # # ----------------------------- # # EMBED A MATPLOTLIB ANIMATION INSIDE YOUR # # OWN GUI! # # # ################################################################### import sys import os from PyQt4 import QtGui from PyQt4 import QtCore import functools import numpy as np import random as rd import matplotlib matplotlib.use("Qt4Agg") from matplotlib.figure import Figure from matplotlib.animation import TimedAnimation from matplotlib.lines import Line2D from matplotlib.backends.backend_qt4agg import FigureCanvasQTAgg as FigureCanvas import time import threading def setCustomSize(x, width, height): sizePolicy = QtGui.QSizePolicy(QtGui.QSizePolicy.Fixed, QtGui.QSizePolicy.Fixed) sizePolicy.setHorizontalStretch(0) sizePolicy.setVerticalStretch(0) sizePolicy.setHeightForWidth(x.sizePolicy().hasHeightForWidth()) x.setSizePolicy(sizePolicy) x.setMinimumSize(QtCore.QSize(width, height)) x.setMaximumSize(QtCore.QSize(width, height)) '''''' class CustomMainWindow(QtGui.QMainWindow): def __init__(self): super(CustomMainWindow, self).__init__() # Define the geometry of the main window self.setGeometry(300, 300, 800, 400) self.setWindowTitle("my first window") # Create FRAME_A self.FRAME_A = QtGui.QFrame(self) self.FRAME_A.setStyleSheet("QWidget { background-color: %s }" % QtGui.QColor(210,210,235,255).name()) self.LAYOUT_A = QtGui.QGridLayout() self.FRAME_A.setLayout(self.LAYOUT_A) self.setCentralWidget(self.FRAME_A) # Place the zoom button self.zoomBtn = QtGui.QPushButton(text = 'zoom') setCustomSize(self.zoomBtn, 100, 50) self.zoomBtn.clicked.connect(self.zoomBtnAction) self.LAYOUT_A.addWidget(self.zoomBtn, *(0,0)) # Place the matplotlib figure self.myFig = CustomFigCanvas() self.LAYOUT_A.addWidget(self.myFig, *(0,1)) # Add the callbackfunc to .. myDataLoop = threading.Thread(name = 'myDataLoop', target = dataSendLoop, daemon = True, args = (self.addData_callbackFunc,)) myDataLoop.start() self.show() '''''' def zoomBtnAction(self): print("zoom in") self.myFig.zoomIn(5) '''''' def addData_callbackFunc(self, value): # print("Add data: " + str(value)) self.myFig.addData(value) ''' End Class ''' class CustomFigCanvas(FigureCanvas, TimedAnimation): def __init__(self): self.addedData = [] print(matplotlib.__version__) # The data self.xlim = 200 self.n = np.linspace(0, self.xlim - 1, self.xlim) a = [] b = [] a.append(2.0) a.append(4.0) a.append(2.0) b.append(4.0) b.append(3.0) b.append(4.0) self.y = (self.n * 0.0) + 50 # The window self.fig = Figure(figsize=(5,5), dpi=100) self.ax1 = self.fig.add_subplot(111) # self.ax1 settings self.ax1.set_xlabel('time') self.ax1.set_ylabel('raw data') self.line1 = Line2D([], [], color='blue') self.line1_tail = Line2D([], [], color='red', linewidth=2) self.line1_head = Line2D([], [], color='red', marker='o', markeredgecolor='r') self.ax1.add_line(self.line1) self.ax1.add_line(self.line1_tail) self.ax1.add_line(self.line1_head) self.ax1.set_xlim(0, self.xlim - 1) self.ax1.set_ylim(0, 100) FigureCanvas.__init__(self, self.fig) TimedAnimation.__init__(self, self.fig, interval = 50, blit = True) def new_frame_seq(self): return iter(range(self.n.size)) def _init_draw(self): lines = [self.line1, self.line1_tail, self.line1_head] for l in lines: l.set_data([], []) def addData(self, value): self.addedData.append(value) def zoomIn(self, value): bottom = self.ax1.get_ylim()[0] top = self.ax1.get_ylim()[1] bottom += value top -= value self.ax1.set_ylim(bottom,top) self.draw() def _step(self, *args): # Extends the _step() method for the TimedAnimation class. try: TimedAnimation._step(self, *args) except Exception as e: self.abc += 1 print(str(self.abc)) TimedAnimation._stop(self) pass def _draw_frame(self, framedata): margin = 2 while(len(self.addedData) > 0): self.y = np.roll(self.y, -1) self.y[-1] = self.addedData[0] del(self.addedData[0]) self.line1.set_data(self.n[ 0 : self.n.size - margin ], self.y[ 0 : self.n.size - margin ]) self.line1_tail.set_data(np.append(self.n[-10:-1 - margin], self.n[-1 - margin]), np.append(self.y[-10:-1 - margin], self.y[-1 - margin])) self.line1_head.set_data(self.n[-1 - margin], self.y[-1 - margin]) self._drawn_artists = [self.line1, self.line1_tail, self.line1_head] ''' End Class ''' # You need to setup a signal slot mechanism, to # send data to your GUI in a thread-safe way. # Believe me, if you don't do this right, things # go very very wrong.. class Communicate(QtCore.QObject): data_signal = QtCore.pyqtSignal(float) ''' End Class ''' def dataSendLoop(addData_callbackFunc): # Setup the signal-slot mechanism. mySrc = Communicate() mySrc.data_signal.connect(addData_callbackFunc) # Simulate some data n = np.linspace(0, 499, 500) y = 50 + 25*(np.sin(n / 8.3)) + 10*(np.sin(n / 7.5)) - 5*(np.sin(n / 1.5)) i = 0 while(True): if(i > 499): i = 0 time.sleep(0.1) mySrc.data_signal.emit(y[i]) # <- Here you emit a signal! i += 1 ### ### if __name__== '__main__': app = QtGui.QApplication(sys.argv) QtGui.QApplication.setStyle(QtGui.QStyleFactory.create('Plastique')) myGUI = CustomMainWindow() sys.exit(app.exec_()) ''''''
I recently rewrote the code for PyQt5.
Code for PyQt5:
################################################################### # # # PLOT A LIVE GRAPH (PyQt5) # # ----------------------------- # # EMBED A MATPLOTLIB ANIMATION INSIDE YOUR # # OWN GUI! # # # ################################################################### import sys import os from PyQt5.QtWidgets import * from PyQt5.QtCore import * from PyQt5.QtGui import * import functools import numpy as np import random as rd import matplotlib matplotlib.use("Qt5Agg") from matplotlib.figure import Figure from matplotlib.animation import TimedAnimation from matplotlib.lines import Line2D from matplotlib.backends.backend_qt5agg import FigureCanvasQTAgg as FigureCanvas import time import threading class CustomMainWindow(QMainWindow): def __init__(self): super(CustomMainWindow, self).__init__() # Define the geometry of the main window self.setGeometry(300, 300, 800, 400) self.setWindowTitle("my first window") # Create FRAME_A self.FRAME_A = QFrame(self) self.FRAME_A.setStyleSheet("QWidget { background-color: %s }" % QColor(210,210,235,255).name()) self.LAYOUT_A = QGridLayout() self.FRAME_A.setLayout(self.LAYOUT_A) self.setCentralWidget(self.FRAME_A) # Place the zoom button self.zoomBtn = QPushButton(text = 'zoom') self.zoomBtn.setFixedSize(100, 50) self.zoomBtn.clicked.connect(self.zoomBtnAction) self.LAYOUT_A.addWidget(self.zoomBtn, *(0,0)) # Place the matplotlib figure self.myFig = CustomFigCanvas() self.LAYOUT_A.addWidget(self.myFig, *(0,1)) # Add the callbackfunc to .. myDataLoop = threading.Thread(name = 'myDataLoop', target = dataSendLoop, daemon = True, args = (self.addData_callbackFunc,)) myDataLoop.start() self.show() return def zoomBtnAction(self): print("zoom in") self.myFig.zoomIn(5) return def addData_callbackFunc(self, value): # print("Add data: " + str(value)) self.myFig.addData(value) return ''' End Class ''' class CustomFigCanvas(FigureCanvas, TimedAnimation): def __init__(self): self.addedData = [] print(matplotlib.__version__) # The data self.xlim = 200 self.n = np.linspace(0, self.xlim - 1, self.xlim) a = [] b = [] a.append(2.0) a.append(4.0) a.append(2.0) b.append(4.0) b.append(3.0) b.append(4.0) self.y = (self.n * 0.0) + 50 # The window self.fig = Figure(figsize=(5,5), dpi=100) self.ax1 = self.fig.add_subplot(111) # self.ax1 settings self.ax1.set_xlabel('time') self.ax1.set_ylabel('raw data') self.line1 = Line2D([], [], color='blue') self.line1_tail = Line2D([], [], color='red', linewidth=2) self.line1_head = Line2D([], [], color='red', marker='o', markeredgecolor='r') self.ax1.add_line(self.line1) self.ax1.add_line(self.line1_tail) self.ax1.add_line(self.line1_head) self.ax1.set_xlim(0, self.xlim - 1) self.ax1.set_ylim(0, 100) FigureCanvas.__init__(self, self.fig) TimedAnimation.__init__(self, self.fig, interval = 50, blit = True) return def new_frame_seq(self): return iter(range(self.n.size)) def _init_draw(self): lines = [self.line1, self.line1_tail, self.line1_head] for l in lines: l.set_data([], []) return def addData(self, value): self.addedData.append(value) return def zoomIn(self, value): bottom = self.ax1.get_ylim()[0] top = self.ax1.get_ylim()[1] bottom += value top -= value self.ax1.set_ylim(bottom,top) self.draw() return def _step(self, *args): # Extends the _step() method for the TimedAnimation class. try: TimedAnimation._step(self, *args) except Exception as e: self.abc += 1 print(str(self.abc)) TimedAnimation._stop(self) pass return def _draw_frame(self, framedata): margin = 2 while(len(self.addedData) > 0): self.y = np.roll(self.y, -1) self.y[-1] = self.addedData[0] del(self.addedData[0]) self.line1.set_data(self.n[ 0 : self.n.size - margin ], self.y[ 0 : self.n.size - margin ]) self.line1_tail.set_data(np.append(self.n[-10:-1 - margin], self.n[-1 - margin]), np.append(self.y[-10:-1 - margin], self.y[-1 - margin])) self.line1_head.set_data(self.n[-1 - margin], self.y[-1 - margin]) self._drawn_artists = [self.line1, self.line1_tail, self.line1_head] return ''' End Class ''' # You need to setup a signal slot mechanism, to # send data to your GUI in a thread-safe way. # Believe me, if you don't do this right, things # go very very wrong.. class Communicate(QObject): data_signal = pyqtSignal(float) ''' End Class ''' def dataSendLoop(addData_callbackFunc): # Setup the signal-slot mechanism. mySrc = Communicate() mySrc.data_signal.connect(addData_callbackFunc) # Simulate some data n = np.linspace(0, 499, 500) y = 50 + 25*(np.sin(n / 8.3)) + 10*(np.sin(n / 7.5)) - 5*(np.sin(n / 1.5)) i = 0 while(True): if(i > 499): i = 0 time.sleep(0.1) mySrc.data_signal.emit(y[i]) # <- Here you emit a signal! i += 1 ### ### if __name__== '__main__': app = QApplication(sys.argv) QApplication.setStyle(QStyleFactory.create('Plastique')) myGUI = CustomMainWindow() sys.exit(app.exec_()) Just try it out. Copy-paste this code in a new python-file, and run it. You should get a beautiful, smoothly moving graph:

None of the methods worked for me. But I have found this Real time matplotlib plot is not working while still in a loop
All you need is to add
plt.pause(0.0001) and then you could see the new plots.
So your code should look like this, and it will work
import matplotlib.pyplot as plt import numpy as np plt.ion() ## Note this correction fig=plt.figure() plt.axis([0,1000,0,1]) i=0 x=list() y=list() while i <1000: temp_y=np.random.random(); x.append(i); y.append(temp_y); plt.scatter(i,temp_y); i+=1; plt.show() plt.pause(0.0001) #Note this correction The top (and many other) answers were built upon plt.pause(), but that was an old way of animating the plot in matplotlib. It is not only slow, but also causes focus to be grabbed upon each update (I had a hard time stopping the plotting python process).
TL;DR: you may want to use matplotlib.animation (as mentioned in documentation).
After digging around various answers and pieces of code, this in fact proved to be a smooth way of drawing incoming data infinitely for me.
Here is my code for a quick start. It plots current time with a random number in [0, 100) every 200ms infinitely, while also handling auto rescaling of the view:
from datetime import datetime from matplotlib import pyplot from matplotlib.animation import FuncAnimation from random import randrange x_data, y_data = [], [] figure = pyplot.figure() line, = pyplot.plot_date(x_data, y_data, '-') def update(frame): x_data.append(datetime.now()) y_data.append(randrange(0, 100)) line.set_data(x_data, y_data) figure.gca().relim() figure.gca().autoscale_view() return line, animation = FuncAnimation(figure, update, interval=200) pyplot.show() You can also explore blit for even better performance as in FuncAnimation documentation.
An example from the blit documentation:
import numpy as np import matplotlib.pyplot as plt from matplotlib.animation import FuncAnimation fig, ax = plt.subplots() xdata, ydata = [], [] ln, = plt.plot([], [], 'ro') def init(): ax.set_xlim(0, 2*np.pi) ax.set_ylim(-1, 1) return ln, def update(frame): xdata.append(frame) ydata.append(np.sin(frame)) ln.set_data(xdata, ydata) return ln, ani = FuncAnimation(fig, update, frames=np.linspace(0, 2*np.pi, 128), init_func=init, blit=True) plt.show() show is probably not the best choice for this. What I would do is use pyplot.draw() instead. You also might want to include a small time delay (e.g., time.sleep(0.05)) in the loop so that you can see the plots happening. If I make these changes to your example it works for me and I see each point appearing one at a time.
I know this question is old, but there's now a package available called drawnow on GitHub as "python-drawnow". This provides an interface similar to MATLAB's drawnow -- you can easily update a figure.
An example for your use case:
import matplotlib.pyplot as plt from drawnow import drawnow def make_fig(): plt.scatter(x, y) # I think you meant this plt.ion() # enable interactivity fig = plt.figure() # make a figure x = list() y = list() for i in range(1000): temp_y = np.random.random() x.append(i) y.append(temp_y) # or any arbitrary update to your figure's data i += 1 drawnow(make_fig) python-drawnow is a thin wrapper around plt.draw but provides the ability to confirm (or debug) after figure display.
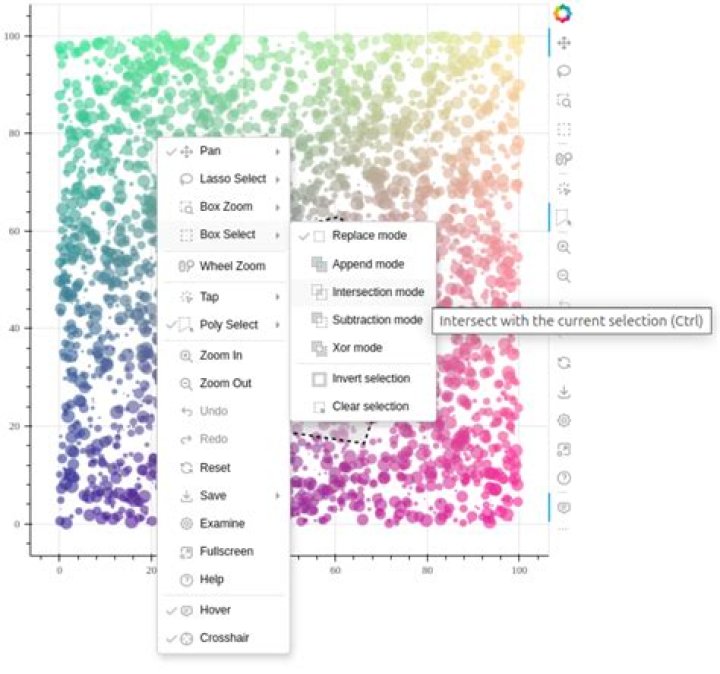
Another option is to go with bokeh. IMO, it is a good alternative at least for real-time plots. Here is a bokeh version of the code in the question:
from bokeh.plotting import curdoc, figure import random import time def update(): global i temp_y = random.random() r.data_source.stream({'x': [i], 'y': [temp_y]}) i += 1 i = 0 p = figure() r = p.circle([], []) curdoc().add_root(p) curdoc().add_periodic_callback(update, 100) and for running it:
pip3 install bokeh bokeh serve --show test.py bokeh shows the result in a web browser via websocket communications. It is especially useful when data is generated by remote headless server processes.
The problem seems to be that you expect plt.show() to show the window and then to return. It does not do that. The program will stop at that point and only resume once you close the window. You should be able to test that: If you close the window and then another window should pop up.
To resolve that problem just call plt.show() once after your loop. Then you get the complete plot. (But not a 'real-time plotting')
You can try setting the keyword-argument block like this: plt.show(block=False) once at the beginning and then use .draw() to update.
An example use-case to plot CPU usage in real-time.
import time import psutil import matplotlib.pyplot as plt fig = plt.figure() ax = fig.add_subplot(111) i = 0 x, y = [], [] while True: x.append(i) y.append(psutil.cpu_percent()) ax.plot(x, y, color='b') fig.canvas.draw() ax.set_xlim(left=max(0, i - 50), right=i + 50) fig.show() plt.pause(0.05) i += 1 Here is a version that I got to work on my system.
import matplotlib.pyplot as plt from drawnow import drawnow import numpy as np def makeFig(): plt.scatter(xList,yList) # I think you meant this plt.ion() # enable interactivity fig=plt.figure() # make a figure xList=list() yList=list() for i in np.arange(50): y=np.random.random() xList.append(i) yList.append(y) drawnow(makeFig) #makeFig() The drawnow(makeFig) command can be replaced #plt.draw() with makeFig(); plt.draw() plt.pause(0.001) The drawnow(makeFig) line can be replaced with a makeFig(); plt.draw() sequence and it still works OK.
1If you want draw and not freeze your thread as more point are drawn you should use plt.pause() not time.sleep()
im using the following code to plot a series of xy coordinates.
import matplotlib.pyplot as plt import math pi = 3.14159 fig, ax = plt.subplots() x = [] y = [] def PointsInCircum(r,n=20): circle = [(math.cos(2*pi/n*x)*r,math.sin(2*pi/n*x)*r) for x in xrange(0,n+1)] return circle circle_list = PointsInCircum(3, 50) for t in range(len(circle_list)): if t == 0: points, = ax.plot(x, y, marker='o', linestyle='--') ax.set_xlim(-4, 4) ax.set_ylim(-4, 4) else: x_coord, y_coord = circle_list.pop() x.append(x_coord) y.append(y_coord) points.set_data(x, y) plt.pause(0.01) This is the right way to plot Dynamic real-time matplot plots animation using while loop
There is a medium article on that too:
pip install celluloid # this will capture the image/animation
import matplotlib.pyplot as plt import numpy as np from celluloid import Camera # getting the camera import matplotlib.animation as animation from IPython import display import time from IPython.display import HTML import warnings %matplotlib notebook warnings.filterwarnings('ignore') warnings.simplefilter('ignore') fig = plt.figure() #Empty fig object ax = fig.add_subplot() #Empty axis object camera = Camera(fig) # Camera object to capture the snap def f(x): ''' function to create a sine wave''' return np.sin(x) + np.random.normal(scale=0.1, size=len(x)) l = [] while True: value = np.random.randint(9) #random number generator l.append(value) # appneds each time number is generated X = np.linspace(10, len(l)) # creates a line space for x axis, Equal to the length of l for i in range(10): #plots 10 such lines plt.plot(X, f(X)) fig.show() #shows the figure object fig.canvas.draw() camera.snap() # camera object to capture teh animation time.sleep(1) And for saving etc:
animation = camera.animate(interval = 200, repeat = True, repeat_delay = 500) HTML(animation.to_html5_video()) animation.save('abc.mp4') # to save output is:
Live plot with circular buffer with line style retained:
import os import time import psutil import collections import matplotlib.pyplot as plt pts_n = 100 x = collections.deque(maxlen=pts_n) y = collections.deque(maxlen=pts_n) (line, ) = plt.plot(x, y, linestyle="--") my_process = psutil.Process(os.getpid()) t_start = time.time() while True: x.append(time.time() - t_start) y.append(my_process.cpu_percent()) line.set_xdata(x) line.set_ydata(y) plt.gca().relim() plt.gca().autoscale_view() plt.pause(0.1)