How do I change the size of my image so it's suitable for printing?
For example, I'd like to use to A4 paper, whose dimensions are 11.7 inches by 8.27 inches in landscape orientation.
13 Answers
You can also set figure size by passing dictionary to rc parameter with key 'figure.figsize' in seaborn set method:
import seaborn as sns sns.set(rc={'figure.figsize':(11.7,8.27)}) Other alternative may be to use figure.figsize of rcParams to set figure size as below:
from matplotlib import rcParams # figure size in inches rcParams['figure.figsize'] = 11.7,8.27 More details can be found in matplotlib documentation
6You need to create the matplotlib Figure and Axes objects ahead of time, specifying how big the figure is:
from matplotlib import pyplot import seaborn import mylib a4_dims = (11.7, 8.27) df = mylib.load_data() fig, ax = pyplot.subplots(figsize=a4_dims) seaborn.violinplot(ax=ax, data=df, **violin_options) Note that if you are trying to pass to a "figure level" method in seaborn (for example lmplot, catplot / factorplot, jointplot) you can and should specify this within the arguments using height and aspect.
sns.catplot(data=df, x='xvar', y='yvar', hue='hue_bar', height=8.27, aspect=11.7/8.27) See and Plotting with seaborn using the matplotlib object-oriented interface for more details on the fact that figure level methods do not obey axes specifications.
3first import matplotlib and use it to set the size of the figure
from matplotlib import pyplot as plt import seaborn as sns plt.figure(figsize=(15,8)) ax = sns.barplot(x="Word", y="Frequency", data=boxdata) You can set the context to be poster or manually set fig_size.
import numpy as np import seaborn as sns import matplotlib.pyplot as plt np.random.seed(0) n, p = 40, 8 d = np.random.normal(0, 2, (n, p)) d += np.log(np.arange(1, p + 1)) * -5 + 10 # plot sns.set_style('ticks') fig, ax = plt.subplots() # the size of A4 paper fig.set_size_inches(11.7, 8.27) sns.violinplot(data=d, inner="points", ax=ax) sns.despine() fig.savefig('example.png') 
This can be done using:
plt.figure(figsize=(15,8)) sns.kdeplot(data,shade=True) In addition to elz answer regarding "figure level" methods that return multi-plot grid objects it is possible to set the figure height and width explicitly (that is without using aspect ratio) using the following approach:
import seaborn as sns g = sns.catplot(data=df, x='xvar', y='yvar', hue='hue_bar') g.fig.set_figwidth(8.27) g.fig.set_figheight(11.7) This shall also work.
from matplotlib import pyplot as plt import seaborn as sns plt.figure(figsize=(15,16)) sns.countplot(data=yourdata, ...) For my plot (a sns factorplot) the proposed answer didn't works fine.
Thus I use
plt.gcf().set_size_inches(11.7, 8.27) Just after the plot with seaborn (so no need to pass an ax to seaborn or to change the rc settings).
2# Sets the figure size temporarily but has to be set again the next plot plt.figure(figsize=(18,18)) sns.barplot(x=housing.ocean_proximity, y=housing.median_house_value) plt.show() 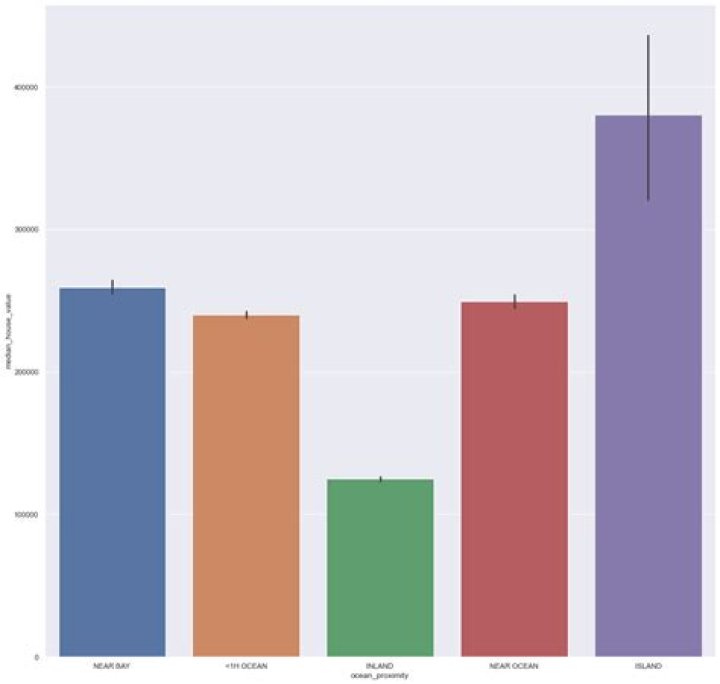
- Adjusting the size of the plot depends if the plot is a figure-level plot like
seaborn.displot, or an axes-level plot likeseaborn.histplot. This answer applies to any figure or axes level plots.- See the the seaborn API reference
seabornis a high-level API formatplotlib, so seaborn works with matplotlib methods- Tested in
python 3.8.12,matplotlib 3.4.3,seaborn 0.11.2
Imports and Data
import seaborn as sns import matplotlib.pyplot as plt # load data df = sns.load_dataset('penguins') sns.displot
- The size of a figure-level plot can be adjusted with the
heightand/oraspectparameters - Additionally, the
dpiof the figure can be set by accessing thefigobject and using.set_dpi()
p = sns.displot(data=df, x='flipper_length_mm', stat='density', height=4, aspect=1.5) p.fig.set_dpi(100) - Without
p.fig.set_dpi(100)
- With
p.fig.set_dpi(100)
sns.histplot
- The size of an axes-level plot can be adjusted with
figsizeand/ordpi
# create figure and axes fig, ax = plt.subplots(figsize=(6, 5), dpi=100) # plot to the existing fig, by using ax=ax p = sns.histplot(data=df, x='flipper_length_mm', stat='density', ax=ax) - Without
dpi=100
- With
dpi=100
The top answers by Paul H and J. Li do not work for all types of seaborn figures. For the FacetGrid type (for instance sns.lmplot()), use the size and aspect parameter.
Size changes both the height and width, maintaining the aspect ratio.
Aspect only changes the width, keeping the height constant.
You can always get your desired size by playing with these two parameters.
Some tried out ways:
import seaborn as sns import matplotlib.pyplot as plt ax, fig = plt.subplots(figsize=[15,7]) sns.boxplot(x="feature1", y="feature2",data=df) # where df would be your dataframe or
import seaborn as sns import matplotlib.pyplot as plt plt.figure(figsize=[15,7]) sns.boxplot(x="feature1", y="feature2",data=df) # where df would be your dataframe