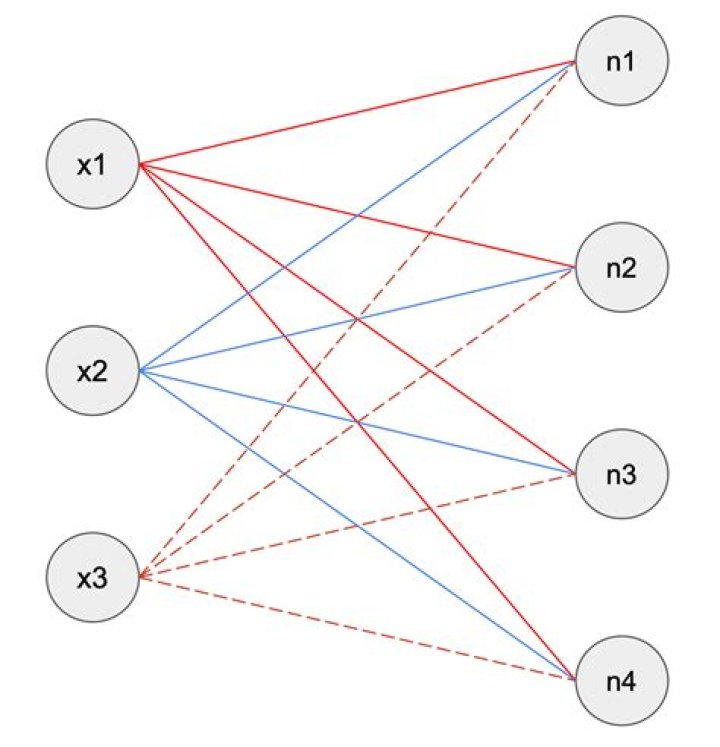
I constructed a pandas dataframe of results. This data frame acts as a table. There are MultiIndexed columns and each row represents a name, ie index=['name1','name2',...] when creating the DataFrame. I would like to display this table and save it as a png (or any graphic format really). At the moment, the closest I can get is converting it to html, but I would like a png. It looks like similar questions have been asked such as How to save the Pandas dataframe/series data as a figure?
However, the marked solution converts the dataframe into a line plot (not a table) and the other solution relies on PySide which I would like to stay away simply because I cannot pip install it on linux. I would like this code to be easily portable. I really was expecting table creation to png to be easy with python. All help is appreciated.
411 Answers
Pandas allows you to plot tables using matplotlib (details here). Usually this plots the table directly onto a plot (with axes and everything) which is not what you want. However, these can be removed first:
import matplotlib.pyplot as plt import pandas as pd from pandas.table.plotting import table # EDIT: see deprecation warnings below ax = plt.subplot(111, frame_on=False) # no visible frame ax.xaxis.set_visible(False) # hide the x axis ax.yaxis.set_visible(False) # hide the y axis table(ax, df) # where df is your data frame plt.savefig('mytable.png') The output might not be the prettiest but you can find additional arguments for the table() function here. Also thanks to this post for info on how to remove axes in matplotlib.
EDIT:
Here is a (admittedly quite hacky) way of simulating multi-indexes when plotting using the method above. If you have a multi-index data frame called df that looks like:
first second bar one 1.991802 two 0.403415 baz one -1.024986 two -0.522366 foo one 0.350297 two -0.444106 qux one -0.472536 two 0.999393 dtype: float64 First reset the indexes so they become normal columns
df = df.reset_index() df first second 0 0 bar one 1.991802 1 bar two 0.403415 2 baz one -1.024986 3 baz two -0.522366 4 foo one 0.350297 5 foo two -0.444106 6 qux one -0.472536 7 qux two 0.999393 Remove all duplicates from the higher order multi-index columns by setting them to an empty string (in my example I only have duplicate indexes in "first"):
df.ix[df.duplicated('first') , 'first'] = '' # see deprecation warnings below df first second 0 0 bar one 1.991802 1 two 0.403415 2 baz one -1.024986 3 two -0.522366 4 foo one 0.350297 5 two -0.444106 6 qux one -0.472536 7 two 0.999393 Change the column names over your "indexes" to the empty string
new_cols = df.columns.values new_cols[:2] = '','' # since my index columns are the two left-most on the table df.columns = new_cols Now call the table function but set all the row labels in the table to the empty string (this makes sure the actual indexes of your plot are not displayed):
table(ax, df, rowLabels=['']*df.shape[0], loc='center') et voila:

Your not-so-pretty but totally functional multi-indexed table.
EDIT: DEPRECATION WARNINGS
As pointed out in the comments, the import statement for table:
from pandas.tools.plotting import table is now deprecated in newer versions of pandas in favour of:
from pandas.plotting import table EDIT: DEPRECATION WARNINGS 2
The ix indexer has now been fully deprecated so we should use the loc indexer instead. Replace:
df.ix[df.duplicated('first') , 'first'] = '' with
df.loc[df.duplicated('first') , 'first'] = '' There is actually a python library called dataframe_image Just do a
pip install dataframe_image Do the imports
import pandas as pd import numpy as np import dataframe_image as dfi df = pd.DataFrame(np.random.randn(6, 6), columns=list('ABCDEF')) and style your table if you want by:
df_styled = df.style.background_gradient() #adding a gradient based on values in cell and finally:
dfi.export(df_styled,"mytable.png") The best solution to your problem is probably to first export your dataframe to HTML and then convert it using an HTML-to-image tool. The final appearance could be tweaked via CSS.
Popular options for HTML-to-image rendering include:
Let us assume we have a dataframe named df. We can generate one with the following code:
import string import numpy as np import pandas as pd np.random.seed(0) # just to get reproducible results from `np.random` rows, cols = 5, 10 labels = list(string.ascii_uppercase[:cols]) df = pd.DataFrame(np.random.randint(0, 100, size=(5, 10)), columns=labels) print(df) # A B C D E F G H I J # 0 44 47 64 67 67 9 83 21 36 87 # 1 70 88 88 12 58 65 39 87 46 88 # 2 81 37 25 77 72 9 20 80 69 79 # 3 47 64 82 99 88 49 29 19 19 14 # 4 39 32 65 9 57 32 31 74 23 35 Using WeasyPrint
This approach uses a pip-installable package, which will allow you to do everything using the Python ecosystem. One shortcoming of weasyprint is that it does not seem to provide a way of adapting the image size to its content. Anyway, removing some background from an image is relatively easy in Python / PIL, and it is implemented in the trim() function below (adapted from here). One also would need to make sure that the image will be large enough, and this can be done with CSS's @page size property.
The code follows:
import weasyprint as wsp import PIL as pil def trim(source_filepath, target_filepath=None, background=None): if not target_filepath: target_filepath = source_filepath img = pil.Image.open(source_filepath) if background is None: background = img.getpixel((0, 0)) border = pil.Image.new(img.mode, img.size, background) diff = pil.ImageChops.difference(img, border) bbox = diff.getbbox() img = img.crop(bbox) if bbox else img img.save(target_filepath) img_filepath = 'table1.png' css = wsp.CSS(string=''' @page { size: 2048px 2048px; padding: 0px; margin: 0px; } table, td, tr, th { border: 1px solid black; } td, th { padding: 4px 8px; } ''') html = wsp.HTML(string=df.to_html()) html.write_png(img_filepath, stylesheets=[css]) trim(img_filepath) 
Using wkhtmltopdf/wkhtmltoimage
This approach uses an external open source tool and this needs to be installed prior to the generation of the image. There is also a Python package, pdfkit, that serves as a front-end to it (it does not waive you from installing the core software yourself), but I will not use it.
wkhtmltoimage can be simply called using subprocess (or any other similar means of running an external program in Python). One would also need to output to disk the HTML file.
The code follows:
import subprocess df.to_html('table2.html') subprocess.call( 'wkhtmltoimage -f png --width 0 table2.html table2.png', shell=True) 
and its aspect could be further tweaked with CSS similarly to the other approach.
0
Although I am not sure if this is the result you expect, you can save your DataFrame in png by plotting the DataFrame with Seaborn Heatmap with annotations on, like this:
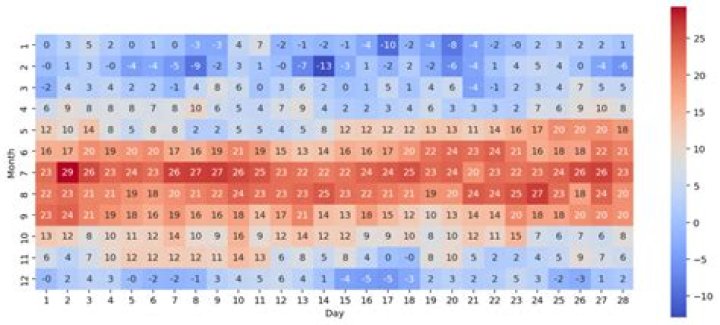
It works right away with a Pandas Dataframe. You can look at this example: Efficiently ploting a table in csv format using Python
You might want to change the colormap so it displays a white background only.
Hope this helps.
Edit: Here is a snippet that does this:
import matplotlib import seaborn as sns def save_df_as_image(df, path): # Set background to white norm = matplotlib.colors.Normalize(-1,1) colors = [[norm(-1.0), "white"], [norm( 1.0), "white"]] cmap = matplotlib.colors.LinearSegmentedColormap.from_list("", colors) # Make plot plot = sns.heatmap(df, annot=True, cmap=cmap, cbar=False) fig = plot.get_figure() fig.savefig(path) The solution of @bunji works for me, but default options don't always give a good result. I added some useful parameter to tweak the appearance of the table.
import pandas as pd import matplotlib.pyplot as plt from pandas.plotting import table import numpy as np dates = pd.date_range('20130101',periods=6) df = pd.DataFrame(np.random.randn(6,4),index=dates,columns=list('ABCD')) df.index = [item.strftime('%Y-%m-%d') for item in df.index] # Format date fig, ax = plt.subplots(figsize=(12, 2)) # set size frame ax.xaxis.set_visible(False) # hide the x axis ax.yaxis.set_visible(False) # hide the y axis ax.set_frame_on(False) # no visible frame, uncomment if size is ok tabla = table(ax, df, loc='upper right', colWidths=[0.17]*len(df.columns)) # where df is your data frame tabla.auto_set_font_size(False) # Activate set fontsize manually tabla.set_fontsize(12) # if ++fontsize is necessary ++colWidths tabla.scale(1.2, 1.2) # change size table plt.savefig('table.png', transparent=True) The result: 
I had the same requirement for a project I am doing. But none of the answers came elegant to my requirement. Here is something which finally helped me, and might be useful for this case:
from bokeh.io import export_png, export_svgs from bokeh.models import ColumnDataSource, DataTable, TableColumn def save_df_as_image(df, path): source = ColumnDataSource(df) df_columns = [df.index.name] df_columns.extend(df.columns.values) columns_for_table=[] for column in df_columns: columns_for_table.append(TableColumn(field=column, title=column)) data_table = DataTable(source=source, columns=columns_for_table,height_policy="auto",width_policy="auto",index_position=None) export_png(data_table, filename = path)
There is a Python library called df2img available at (disclaimer: I'm the author). It's a wrapper/convenience function using plotly as backend.
You can find the documentation at readthedocs
import pandas as pd import df2img df = pd.DataFrame( data=dict( float_col=[1.4, float("NaN"), 250, 24.65], str_col=("string1", "string2", float("NaN"), "string4"), ), index=["row1", "row2", "row3", "row4"], ) Saving a pd.DataFrame as a .png-file can be done fairly quickly. You can apply formatting, such as background colors or alternating the row colors for better readability.
fig = df2img.plot_dataframe( df, title=dict( font_color="darkred", font_family="Times New Roman", font_size=16, text="This is a title", ), tbl_header=dict( align="right", fill_color="blue", font_color="white", font_size=10, line_color="darkslategray", ), tbl_cells=dict( align="right", line_color="darkslategray", ), row_fill_color=("#ffffff", "#d7d8d6"), fig_size=(300, 160), ) df2img.save_dataframe(fig=fig, filename="plot.png") 
If you're okay with the formatting as it appears when you call the DataFrame in your coding environment, then the absolute easiest way is to just use print screen and crop the image using basic image editing software.
Here's how it turned out for me using Jupyter Notebook, and Pinta Image Editor (Ubuntu freeware).
2As jcdoming suggested, use Seaborn heatmap():
import seaborn as sns import matplotlib.pyplot as plt fig = plt.figure(facecolor='w', edgecolor='k') sns.heatmap(df.head(), annot=True, cmap='viridis', cbar=False) plt.savefig('DataFrame.png') 
The following would need extensive customisation to format the table correctly, but the bones of it works:
import numpy as np from PIL import Image, ImageDraw, ImageFont import pandas as pd df = pd.DataFrame({ 'A' : 1., 'B' : pd.Series(1,index=list(range(4)),dtype='float32'), 'C' : np.array([3] * 4,dtype='int32'), 'D' : pd.Categorical(["test","train","test","train"]), 'E' : 'foo' }) class DrawTable(): def __init__(self,_df): self.rows,self.cols = _df.shape img_size = (300,200) self.border = 50 self.bg_col = (255,255,255) self.div_w = 1 self.div_col = (128,128,128) self.head_w = 2 self.head_col = (0,0,0) self.image = Image.new("RGBA", img_size,self.bg_col) self.draw = ImageDraw.Draw(self.image) self.draw_grid() self.populate(_df) self.image.show() def draw_grid(self): width,height = self.image.size row_step = (height-self.border*2)/(self.rows) col_step = (width-self.border*2)/(self.cols) for row in range(1,self.rows+1): self.draw.line((self.border-row_step//2,self.border+row_step*row,width-self.border,self.border+row_step*row),fill=self.div_col,width=self.div_w) for col in range(1,self.cols+1): self.draw.line((self.border+col_step*col,self.border-col_step//2,self.border+col_step*col,height-self.border),fill=self.div_col,width=self.div_w) self.draw.line((self.border-row_step//2,self.border,width-self.border,self.border),fill=self.head_col,width=self.head_w) self.draw.line((self.border,self.border-col_step//2,self.border,height-self.border),fill=self.head_col,width=self.head_w) self.row_step = row_step self.col_step = col_step def populate(self,_df2): font = ImageFont.load_default().font for row in range(self.rows): print(_df2.iloc[row,0]) self.draw.text((self.border-self.row_step//2,self.border+self.row_step*row),str(_df2.index[row]),font=font,fill=(0,0,128)) for col in range(self.cols): text = str(_df2.iloc[row,col]) text_w, text_h = font.getsize(text) x_pos = self.border+self.col_step*(col+1)-text_w y_pos = self.border+self.row_step*row self.draw.text((x_pos,y_pos),text,font=font,fill=(0,0,128)) for col in range(self.cols): text = str(_df2.columns[col]) text_w, text_h = font.getsize(text) x_pos = self.border+self.col_step*(col+1)-text_w y_pos = self.border - self.row_step//2 self.draw.text((x_pos,y_pos),text,font=font,fill=(0,0,128)) def save(self,filename): try: self.image.save(filename,mode='RGBA') print(filename," Saved.") except: print("Error saving:",filename) table1 = DrawTable(df) table1.save('C:/Users/user/Pictures/table1.png') The output looks like this:
The easiest and fastest way to convert a Pandas dataframe into a png image using Anaconda Spyder IDE- just double-click on the dataframe in variable explorer, and the IDE table will appear, nicely packaged with automatic formatting and color scheme. Just use a snipping tool to capture the table for use in your reports, saved as a png:
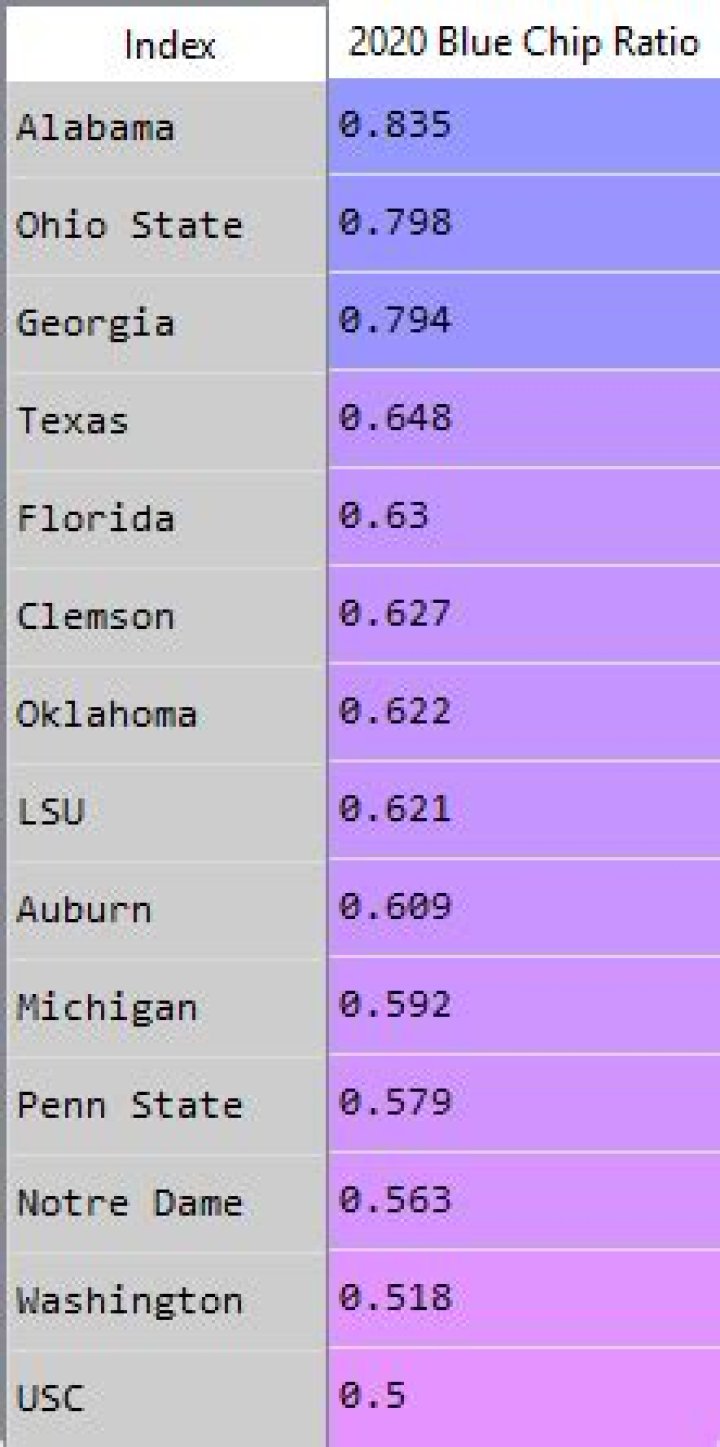
This saves me lots of time, and is still elegant and professional.