I have a multi-index Pandas dataframe that I want to plot as a boxplot. This should be easy to do yet I find myself unable to get exactly what I want. The data looks like this:
hedges mask model_name hedges_std hedges_min \ period season 2021-2025 winter 0.864328 1.0 ensemble 0.301748 0.124708 spring 0.740410 1.0 ensemble 0.202963 0.049319 summer 0.526264 1.0 ensemble 0.105750 0.162856 fall 0.531141 1.0 ensemble 0.046278 0.388827 2025-2050 winter 1.715075 1.0 ensemble 0.373866 0.582819 spring 1.252963 1.0 ensemble 0.370402 0.408695 summer 0.854958 1.0 ensemble 0.076193 0.528038 fall 0.759645 1.0 ensemble 0.068928 0.498271 2050-2075 winter 2.981373 1.0 ensemble 0.928940 1.139801 spring 2.042320 1.0 ensemble 0.748642 0.716289 summer 1.299277 1.0 ensemble 0.092611 0.812979 fall 1.108852 1.0 ensemble 0.109014 0.653199 2021-2025 winter 0.864328 1.0 ensemble 0.301748 0.124708 spring 0.740410 1.0 ensemble 0.202963 0.049319 summer 0.526264 1.0 ensemble 0.105750 0.162856 fall 0.531141 1.0 ensemble 0.046278 0.388827 2025-2050 winter 1.715075 1.0 ensemble 0.373866 0.582819 spring 1.252963 1.0 ensemble 0.370402 0.408695 summer 0.854958 1.0 ensemble 0.076193 0.528038 fall 0.759645 1.0 ensemble 0.068928 0.498271 2050-2075 winter 2.981373 1.0 ensemble 0.928940 1.139801 spring 2.042320 1.0 ensemble 0.748642 0.716289 summer 1.299277 1.0 ensemble 0.092611 0.812979 fall 1.108852 1.0 ensemble 0.109014 0.653199 hedges_max model_scenario period season 2021-2025 winter 1.760912 ssp245 spring 1.189956 ssp245 summer 0.662142 ssp245 fall 0.687793 ssp245 2025-2050 winter 2.423660 ssp245 spring 2.040903 ssp245 summer 1.055890 ssp245 fall 0.965831 ssp245 2050-2075 winter 5.179203 ssp245 spring 3.898118 ssp245 summer 1.536149 ssp245 fall 1.435503 ssp245 2021-2025 winter 1.760912 ssp585 spring 1.189956 ssp585 summer 0.662142 ssp585 fall 0.687793 ssp585 2025-2050 winter 2.423660 ssp585 spring 2.040903 ssp585 summer 1.055890 ssp585 fall 0.965831 ssp585 2050-2075 winter 5.179203 ssp585 spring 3.898118 ssp585 summer 1.536149 ssp585 fall 1.435503 ssp585 I want to plot the data showing one box for each period and season separated in color by scenario. Each box would be defined by its mean (hedges), standard deviation (std), and potentially min and max range. The idea is to show how the future periods will change the estimated hedges distributions. I have tried a variety of combinations around:
sns.boxplot(data=df, x="season", y="hedges", hue="model_scenario") My error Could not interpret input 'season' is related to the multi-index which I clearly have to group or split somehow but that's where I keep failing. Suggestions for how to plot these data are appreciated.
1 Answer
I assume your goal is to generate a figure like this:
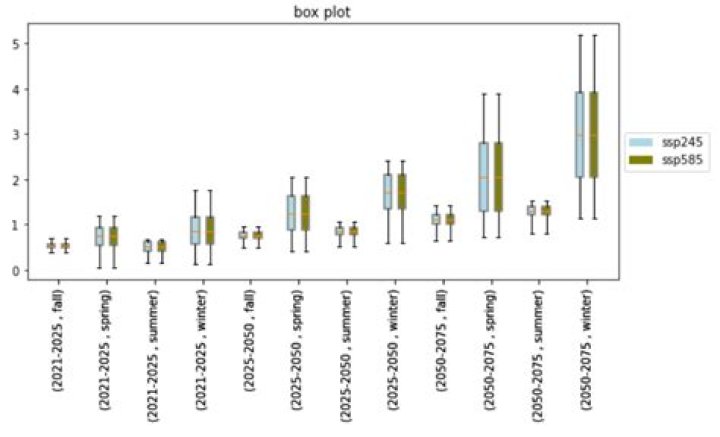
Since you have the boxplot-statistics of your boxes already calculated, the function sns.boxplot() and also matplotlib.axes.Axes.boxplot() from matplotlib (which is the seaborn backend and called inside sns.boxplot()) aren't the functions you can use anymore. The ax.boxplot() trys to calculate the statistics by itself, therefor this is not the way to go.
After calculating the boxplot-statistics matplotlib.axes.Axes.boxplot() calls [matplotlib.axes.Axes.bxp()]() and this is a function you can use, too.
The function matplotlib.axes.Axes.boxplot() takes a dict with this name convention:
- med: The median (scalar float),
- q1: The first quartile (25th percentile) (scalar float),
- q3: The third quartile (75th percentile) (scalar float),
- whislo: Lower bound of the lower whisker (scalar float),
- whishi: Upper bound of the upper whisker (scalar float),
and with only small modifications we can rename or genreate the needed columns of you DataFrame. But first reset you multiindex.
# df is defined and the multiinde df = df.rename({'hedges':'med', 'hedges_min':'whislo', 'hedges_max':'whishi'}, axis=1) df['q1'] = df['med'] - df['hedges_std'] df['q3'] = df['med'] + df['hedges_std'] df['label'] = df.apply(lambda x: '('+ x['period'] +' , '+ x['season'] + ')', axis=1) df = df[['med', 'whislo','whishi','q1','q3', 'label']] # this are the columns we need >>> df.head(5) med whislo whishi q1 q3 label 0 0.864328 0.124708 1.760912 0.562580 1.166076 (2021-2025 , winter) 1 0.740410 0.049319 1.189956 0.537447 0.943373 (2021-2025 , spring) 2 0.526264 0.162856 0.662142 0.420514 0.632014 (2021-2025 , summer) 3 0.531141 0.388827 0.687793 0.484863 0.577419 (2021-2025 , fall) 4 1.715075 0.582819 2.423660 1.341209 2.088941 (2025-2050 , winter) I decided to create a label combining period and season. Every label appears twice, for each model_scenario exactly one time.
Here is the code how I created the figure above. It is not perfect, but it shows, how it works. Some of the sections a realated to the code of sns.boxplot().
from matplotlib import rcParams import matplotlib.pyplot as plt colors = ['lightblue', 'olive'] model_scenario = ["ssp245", "ssp585"] fig, ax = plt.subplots(figsize=(9, 4)) ax.set_title('box plot') x_tick_label = [] x_tick_position = [] for i, group in enumerate(data_to_plt.groupby('label')): for j in range(group[1].shape[0]): x_tick_label.append(group[0]) x_tick_position.append(i) if j ==0: p = i - 0.15 else: p = i + 0.15 artist_dict = ax.bxp( bxpstats=[group[1].drop('label', axis=1).iloc[j].to_dict()], showfliers=False, patch_artist=True, positions=[p] ) for box in artist_dict["boxes"]: box.update(dict(facecolor=colors[j], zorder=.9, edgecolor='gray', linewidth=rcParams["lines.linewidth"]) ) if i == 0: rect = plt.Rectangle([0,0], 0, 0, linewidth=0, edgecolor='gray', facecolor=colors[j], label=model_scenario[j]) ax.add_patch(rect) ax.legend(loc='center left', bbox_to_anchor=(1, 0.5)) plt.xticks(x_tick_position, x_tick_label, rotation = 90) To summerize what I am doing with matplotlib:
- I group by
model_scenarioakalabels - I generate the labels for the legend
- I draw the boxes using
bxp() - I rewrite the x-ticks